If you are a Data Analyst or you are going to be one then you need to master Power BI and one of the most important concept in Power BI is to master Filters in Power BI.
There are 8 types of filters in Power BI and each makes you work easy in different ways. That is the reason why filters in Power BI is one of the most asked questions.
In this article we will discuss What are the Different Types of Filters in Power BI and how to use them and we will also understand when to use each filter.
Key Take Away
- What are different type of filters ?
- How each filters differs from each other?
- When to use which filters ?
- How to optimize Power BI performance with the help of filters?
- Mistakes to avoid while using Power BI filters ?
What Are Filters in Power BI?
Filters in Power BI are tools used to narrow down the data shown in your reports and dashboards. Basically you can filter out the data by applying sorting or filtering by applying different type of filters and getting the desired output as per filters.
Power BI filters helps you focus on specific information by including only the data you want to see and excluding the rest. Filters allow you to customize and control what is displayed based on certain criteria, making your reports more insightful.
Why filters are important in Power BI?
Filters in Power BI are important because they allow users to focus on specific data which is required and avoiding unnecessary data thus making reports more meaningful and easier to understand.
Let us understand why filters are important:
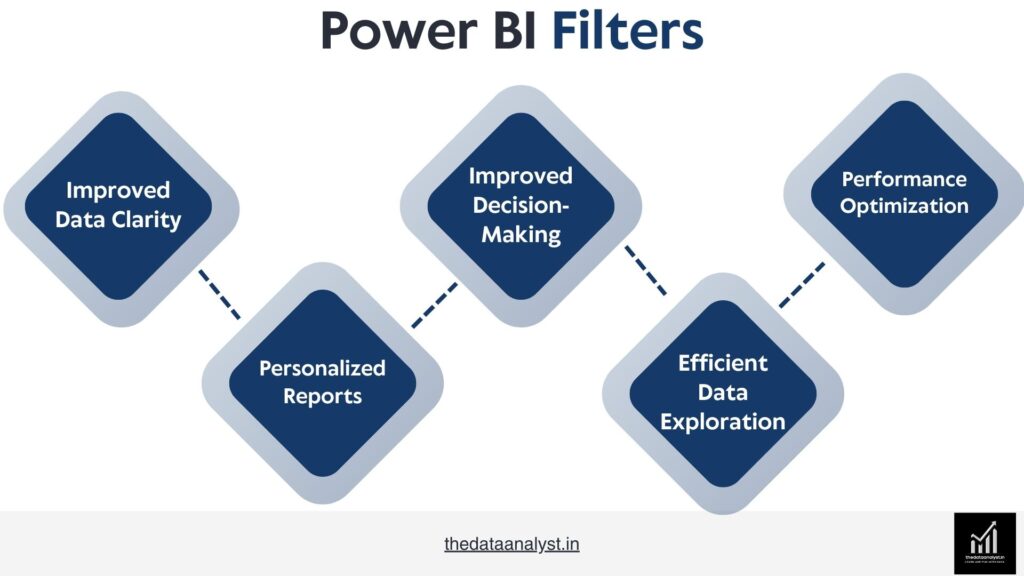
- Improved Data Clarity: Filters help remove irrelevant or unnecessary data, allowing users to zoom in on then relevant information. This simplifies large datasets and makes it easier to spot trends and insights.
- Personalized Reports: Filters enable customization of reports for different users or different needs. For example, a sales report can be filtered by region, time period, or product category to meet the specific needs of different stakeholders.
- Improved Decision-Making: By filtering data, users can isolate key metrics which is helpful in better, more informed decision-making. It ensures that the data being analyzed is directly aligned with business goals.
- Efficient Data Exploration: Filters, especially interactive ones like slicers, allow users to explore and analyze data dynamically, making it easy to answer specific questions or dive deeper into particular areas of interest.
- Performance Optimization: Filtering reduces the amount of data being processed or displayed, which can improve report performance, especially when working with large datasets.
What are three levels of filters in Power BI?
We have three different levels at which we can apply filters in Power BI . Each of this serves a unique purpose in managing and displaying data.
Let us understand the purpose and use case of each of these three levels of filters:
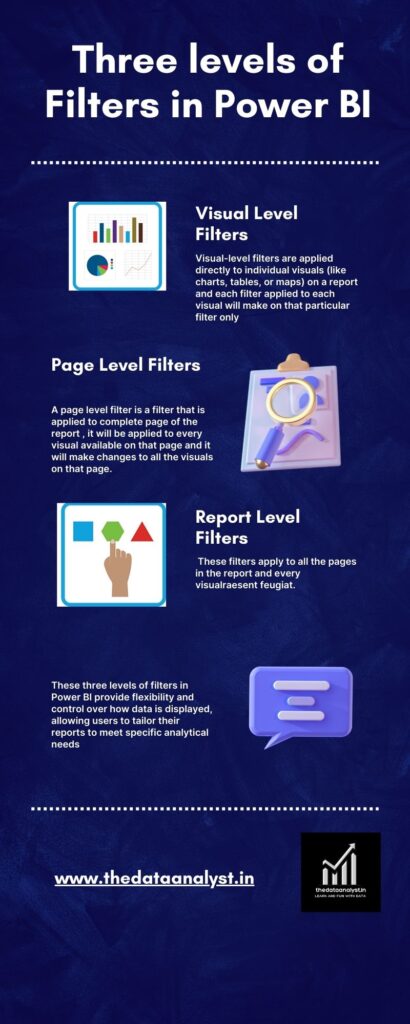
- Visual-Level Filters: Visual-level filters are applied directly to individual visuals (like charts, tables, or maps) on a report and each filter applied to each visual will make on that particular filter only .
- Page-Level Filters: A page level filter is a filter that is applied to complete page of the report , it will be applied to every visual available on that page and it will make changes to all the visuals on that page.
- Report-Level Filters: These filters apply to all the pages in the report and every visual.
These three levels of filters in Power BI provide flexibility and control over how data is displayed, allowing users to tailor their reports to meet specific analytical needs.
What are the Different Types of Filters in Power BI ?
Apart from these different level of filters we have more filters as well so let us discuss all these different type of filters and understand how to use them.
Let us understand all these different filters and we will even understand their use case and purpose of using these filters , after this you will not have to look anywhere else to understand the filters in Power BI.
1. Visual-Level Filters
What Are Visual-Level Filters?
Visual-level filters are specific to particular visuals in Power BI, such as charts or tables. They only change the data displayed within that particular visual without affecting others.
Use Cases:
- Highlight specific metrics, such as sales for a particular product.
- Exclude outliers from analysis in one visual.
Purpose:
The main purpose of visual-level filters is to refine the data shown in individual visuals, enabling a focused analysis while keeping the overall report intact. They will change only particular visual on that page avoiding other filters.
How to Use Visual-Level Filters:
- Select the visual you want to filter.
- In the “Visualizations” pane, find the “Filters” section.
- Drag the field you want to filter by into the “Visual level filters” area.
- Set the desired filter criteria (e.g., select specific values or ranges).
2. Page-Level Filters
What Are Page-Level Filters?
Page-level filters apply to all visuals on a single report page, ensuring consistent data display. If we apply this filter all the visuals on the particular page will be affected by that.
Use Cases:
- Analyze sales data for a specific quarter across multiple visuals.
- Filter customer demographics for a specific segment.
Purpose:
To provide a unified view across all visuals on a page. All the visuals on single page needs to be changed.
How to Use Page-Level Filters:
- Click on the “Filters” pane on the right side of the Power BI report view.
- Drag the desired field into the “Page level filters” area.
- Set the filtering criteria for the field.
3. Report-Level Filters
What Are Report-Level Filters?
Report-level filters affect every visual across all pages in the report.
Use Cases:
- Show only a specific region’s performance across all pages.
- Apply a time filter for the current year throughout the report.
Purpose:
To create a cohesive view of data across the entire report. All the data across all the pages in this report will be affected by this filter.
How to Use Report-Level Filters:
- Open the “Filters” pane on the right side.
- Drag the field you want to filter by into the “Report level filters” area.
- Configure the filter settings to suit your needs.
4. Drill through Filters
What Are Drill through Filters?
Drill through filters allow users to navigate from one report page to another, passing specific filter criteria.
Use Cases:
- Click on a specific product in a sales chart to view detailed sales data on another page.
- Access a customer summary by clicking their name.
Purpose:
To explore detailed information related to specific data points.
How to Use Drill through Filters:
- Create a new report page for detailed analysis.
- In the “Visualizations” pane, find the “Drill through” section.
- Drag a field into the “Add drill through fields here” area.
- On the main page, ensure the relevant visual is selected, then right-click on a data point to drill through.
5. Drilldown Filters
What Are Drilldown Filters?
Drilldown filters allow users to view data at different levels of detail within the same visual.
Use Cases:
- Analyze yearly sales and drill down to see monthly performance.
- View product categories and then specific products.
Purpose:
To facilitate deeper analysis of data hierarchies.
How to Use Drilldown Filters:
- Create a visual that has a hierarchical data structure (e.g., a bar chart with years and months).
- Click on the visual, then select the “Expand” button (a downward arrow) to drill down to the next level of detail.
- Use the “Go back” button (upward arrow) to return to the previous level.
6. Cross-Filtering & Cross-Highlighting
What Are Cross-Filtering & Cross-Highlighting?
Cross-filtering allows one visual to filter data in another, while cross-highlighting highlights related data across visuals.
Use Cases:
- Click on a region in a map to filter sales data in a table.
- Highlight products in a chart based on a selected category.
Purpose:
To enhance interactivity and data exploration.
How to Use Cross-Filtering & Cross-Highlighting:
- Create multiple visuals on a report page.
- Click on a data point in one visual (e.g., a bar in a bar chart).
- Observe that other visuals automatically update to reflect related data based on the selection.
7. Slicers
What Are Slicers?
Slicers are visual filters that allow users to select specific values from lists or ranges.
Use Cases:
- Filter sales data by selecting specific regions.
- Allow users to choose which categories to display.
Purpose:
To provide an interactive way for users to filter data.
How to Use Slicers:
- From the “Visualizations” pane, select the “Slicer” visual.
- Drag a field into the slicer visual (e.g., region or product type).
- Adjust the slicer settings to allow for single or multiple selections.
- Users can then select values in the slicer to filter data across all visuals.
8. Top N Filters
What Are Top N Filters?
Top N filters display only the top or bottom “N” items based on specific criteria.
Use Cases:
- Show the top 10 best-selling products.
- Highlight the lowest-performing regions.
Purpose:
To quickly identify the most significant data points.
How to Use Top N Filters:
- Select a visual (e.g., bar chart) that displays data you want to filter.
- In the “Filters” pane, drag a field into the “Visual level filters” section.
- Click on the field and choose “Top N.”
- Enter the number of items (e.g., 10) you want to display.
- Set the measure by which to rank (e.g., sales amount) and apply the filter.
What is Cross filtering in Power BI ?
Cross filtering in Power BI is a feature that allows users to interact with multiple visuals in a report at once. When you select a data point in one visual, Power BI automatically filters or highlights related data across other visuals on the same report page. This makes it easier to explore and analyze data by observing how changes in one part of your dataset affect the others.
How Cross Filtering Works in Power BI
Power BI reports typically consist of several visualizations like bar charts, pie charts, and tables. With cross filtering, if you click on a specific element (e.g., a bar representing sales in a particular region), other visuals in the report will immediately adjust to reflect data related only to that selection. This dynamic interaction helps you focus on relevant information quickly.
Difference between Slicers and Filters in Power BI ?
Slicers and filters are both tools in Power BI used to narrow down data, but they work slightly differently.
A slicer is a visual element, like a button or dropdown, that lets users interactively filter data on a report page. It’s visible on the report and offers a quick, easy way to filter data by categories, dates, or other fields. Slicers are often used for their ease of use and helping make reports more interactive.
On the other hand, a filter is typically applied in the background and doesn’t appear directly on the report page. Filters can be applied at various levels, such as report-level (affecting the entire report), page-level (affecting one page), or visual-level (affecting specific visuals). They offer more flexibility and depth in data filtering but aren’t as user-friendly for those exploring reports interactively.
Key Differences between Slicers and Filters in Power BI:
- Slicers: Visible, user-friendly, interactive filtering options directly on the report.
- Filters: Applied in the background with more precision, but not always visible to the user.
Both slicers and filters enhance data exploration, but slicers are more interactive, while filters offer greater control.
How to optimize Power BI report performance using Filters ?
Optimizing Power BI report performance is very important for faster load times and smoother user experiences. If your Power BI report is using a heavy big data file then chances are it is super slow.
One of the solution for this is to optimize your report filters in a better way so let us understand it.
4 Ways to Optimize Power BI report using filters in Power BI
1. Apply Visual-Level Filters
Using visual-level filters helps limit the data being processed by each visual. Instead of applying filters to the entire report, focus on individual visuals to reduce the data load, improving the report’s speed.
2. Use Page-Level Filters
If you’re dealing with a lot of data across multiple visuals, applying page-level filters helps by filtering data for the entire page, making the report more responsive. This reduces the number of unnecessary calculations, making the report faster.
3. Leverage Report-Level Filters
For filtering data across multiple pages, report-level filters are useful. By filtering data at the report level, you minimize the amount of data that Power BI needs to process, improving overall performance.
4. Avoid Complex Filters
Try to avoid using too many complex filters. Complex filtering logic increases the processing time and can slow down the report. Stick to straightforward filters for better performance.
By applying these filter strategies, you can improve the performance of your Power BI reports and ensure a faster, more efficient experience for users.
4 Mistakes You Should Avoid When Using Filters in Power BI
Using filters in Power BI is essential for effective data analysis, but there are some common mistakes that can negatively impact your report’s performance and usability.
If you will, avoid these mistakes then the performance of your report will be amazing so let us understand them.
Here are the top mistakes to avoid:
1. Applying Too Many Filters
Overloading your report with too many filters can slow down performance. Stick to the necessary filters that add value to the analysis, rather than adding filters for every minor detail.
2. Not Using the Right Filter Level
Choosing the wrong filter level can lead to confusion. For example, using visual-level filters when page-level or report-level filters are needed can make your report inconsistent and harder to manage.
3. Using Complex Filter Logic
Overcomplicating filters with too many conditions can increase processing time, leading to slower reports. Keep your filters simple and efficient to maintain optimal performance.
4. Not Testing Filter Performance
Failing to test how filters affect report performance can lead to slow load times. Always test your report with filters applied to see if there’s a noticeable impact on speed.
Avoiding these mistakes will ensure that your Power BI reports run smoothly and deliver accurate, timely insights without performance issues.
FAQ
How many types of filters are there in Power BI?
Power BI has three types of filters: Visual-Level Filters (apply to individual visuals), Page-Level Filters (affect all visuals on a single page), and Report-Level Filters (apply to all visuals across the entire report).
What are the different types of context filters in Power BI?
Power BI has two main types of context filters: Row Context, which applies to calculations within a specific row, and Filter Context, which is based on the filters applied to visuals, pages, or reports to narrow down the data being analyzed.
What is the difference between report level , visual level and page level filters ?
Report Level Filters apply to all visuals across the entire report, ensuring consistent data display.
Page Level Filters affect all visuals on a specific page, allowing for focused analysis within that page.
Visual Level Filters are applied to individual visuals only, tailoring the data shown in each chart or graph without impacting others.
Conclusion
In conclusion, filters in Power BI are important for creating insightful and efficient reports. With so many types of filters available, including visual-level, page-level, and report-level filters, it is important to understand when and how to use these filters, so that you can improve your report performance, streamline data exploration, and make more informed decisions.
Whether you’re focusing on specific data points or presenting a comprehensive view across multiple pages, the right filtering strategy can transform your reporting experience.
If you found this article helpful, please consider sharing it with your network and leaving a comment below! Your feedback is invaluable and helps us create more relevant content for you. Happy analyzing!
Nice post please follow our blog